|
|
Home Page |
3D 3-day trajectories
|


This is the home page for the
Introduction
Parcel
trajectories are often calculated to obtain an appreciation of the history of
air masses (e.g. Fuelburg et al., 1996). The
direction and length of trajectories are useful in diagnosing processes that
may affect particular air masses under certain conditions. In this regard it is
important that parcel trajectories are determined accurately.
The three-dimensional (3D) algorithm
presented here (traj3d) builds on the two-dimensional (2D) model of Law (1993) and
reported in application by Perrin and Simmonds (1995). From a specified parcel
location in the atmosphere, xn at
time n, a finite integral is solved
to advect the parcel and generate the trajectory
path. Given the 3D wind v(xn) the governing prognostic equation for the
trajectory path over a short time interval Δt is xn+1 = xn + v Δt . The
wind at a given point is found by cubically interpolating from a spatial grid
then linearly in time. For back trajectories the wind direction is reversed.
The finite integral is solved using a fourth-order Runge-Kutta
scheme to obtain an estimate of the wind. This method is considerably more
accurate for trajectory calculations than a simple first-order approach. For mathematical details about the 3D algorithm see Noone and
Simmonds (1999) and Barras and Simmonds (2009).
We present an implementation of the
3D algorithm in Fortran 77 that is suitable for any platform given an
appropriate compiler. A precompiled Linux version is also available. The input
to the program is a simple binary format referred to as CMP. At present the
input data (usually 3D winds) are limited to constant pressure levels (e.g.
1000, 925, 850 hPa etc) as is the case with the
commonly available reanalysis products e.g. NCEP reanalysis. The output of the
program is a NetCDF file (and therefore NetCDF libraries need to be accessible
for compilation) and this may be imported into many software packages e.g. Matlab, NCL, for subsequent analysis and plotting. We
include some utilities to convert from NetCDF (a common format for 3D
meteorological fields like winds) to CMP as well as plotting the trajectories
based on NCAR Graphics/NCL.
Although intended for computing 3D
trajectories the algorithm is equally
applicable to 2D trajectory studies e.g. 10 m winds, or a single
pressure level e.g. 500 hPa. Finally, it is possible
to interpolate auxiliary variables
e.g. air temperature, to the trajectory positions and include these in the
output NetCDF file.
Obtaining
the
The trajectory software (traj3d) is freely
available from our group. It is written in Fortran 77 and should compile
correctly on any platform with a suitable compiler e.g. the GNU g77 compiler.
To date it has been compiled successfully on systems running Solaris, Linux and
Cygwin under Microsoft Windows XP. We also provide a
Linux binary version of the software which should work on many Linux systems.
In addition we plan to provide a version suitable for Cygwin
under Microsoft Windows XP that presumably also works with
The present version
is intended for 3D wind data from the common reanalysis projects. The input
data should be zonal and meridional winds (u,v) plus omega (w) on a set of pressure levels e.g. 1000,
850, 500, 200 hPa.
However it may equally be used for computing 2D (single level)
trajectories e.g. 500 hPa, 10 m winds. Furthermore
the software will work on either a global or regional grid. The input data are
expected to be in a simple binary format that we refer to as ‘conmap’ (CMP). Details of this format are given in the
software documentation.
We provide some
additional Fortran 77 software (read_nc2cmp) to assist in
converting GRIB or NetCDF data to the CMP format. The trajectory data is output
in NetCDF and this may be processed further by the user or input to a suitable
plotting package. We include a utility based on NCAR Graphics (kmapline) as well as an
elementary plotting script for NCL. Note that the actual trajectory software
does not require any graphics libraries: the only external libraries required
for compilation are NetCDF (version 3+).
|
The
software may be obtained by contacting: Ian Simmonds |
Please indicate the platform that you intend
to run the software on. We recommend the g77 compiler but the software should compile with others but we can’t
test these ourselves.
Documentation
A detailed
description of the software package including compilation and examples is given
in the Documentation.
Please direct any
questions or report any problems to Kevin
Keay.
The animation at the top of this page
The animation at the upper right of this page
shows 3-day back trajectories arriving in
The trajectories
begin on April 17 1996 00 UTC and end on April 20 1996 00 UTC. These are
computed at a one hour interval and the evolution is shown every six hours in
the animation. The symbols indicate the times 00, 06, 12 and 18 UTC but the
intermediate (hourly) points are also present in the plotted trajectories. Different colours
correspond to the different arrival levels of the trajectories as shown in the
key.
Note that each 3D trajectory is moving
through different levels in the atmosphere during the journey from source to arrival
location. Below is the final frame of the animation:
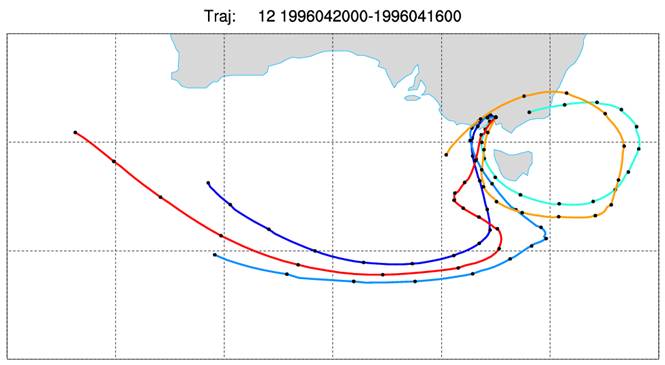
1000 hPa 925 hPa 850 hPa 700 hPa 500 hPa
Click here
for a larger animation (0.4 MB).
Copyright and Disclaimer
We use the parcel trajectory software that
is presented here in our published research. Although every effort has been
made to ensure that the software is correct we can not guarantee it is free
from errors. Hence we take no responsibility for any negative consequences
arising from its use by any party external to our group at the
The output of the trajectory software, as
data files or images, may be freely used for research and publications
including journals and books. It would be appreciated that you include an
appropriate reference to this web site. For instance:
The parcel trajectory
software (traj3d) was obtained from the
Noone, D., and I.
Simmonds, 1999: A three-dimensional spherical trajectory algorithm. Research
Activities in Atmospheric and Oceanic Modelling,
Report No. 28, WMO/TD-No. 942. H. Ritchie, Ed., World
Meteorological Organization, 3.26-3.27.
Barras,
V., and I. Simmonds, 2009: Observation and modeling of stable water isotopes as
diagnostics of rainfall dynamics over southeastern
Meteorology at the
Details about our group are
available here:
Meteorology Group,
References
Fuelburg, H.E., R.O. Loring
Jr., M.V. Watson, M.C. Sinha, K.E. Pickering, A.M.
Thomson, G.W. Sachse, D.R. Blade and M.R. Schoeberl, 1996: TRACE: A trajectory intercomparison
2. Isentropic and kinematic methods. Journal of Geophysical Research, 101, 23927-23939.
Noone,
D., and I. Simmonds, 1999: A three-dimensional spherical trajectory algorithm.
Research Activities in Atmospheric and Oceanic Modelling,
Report No. 28, WMO/TD-No. 942. H. Ritchie, Ed., World
Meteorological Organization, 3.26-3.27.
Law,
R.M., 1993: Modelling the global transport of atmospheric
constituents. PhD thesis,
Perrin,
G. and I. Simmonds, 1995: The origins and characteristics of cold air outbreaks
over
Barras, V., and I. Simmonds, 2009: Observation and modeling of stable
water isotopes as diagnostics of rainfall dynamics over southeastern
Last Update: December 22 2009
Maintained by: Kevin Keay